trend.js
const getMax = (a,b)=>a>b?a:b
const convertX = (width,x,sum,{left,right})=>  parseInt((width-left-right) * x /(sum-1))+left
const convertY =  (height,y,sum,{bottom,top})=>height - convertX(height,y,sum,{left:bottom,right:top})
const convertPoint = (width,height,max,len,padding)=> (a,b)=> [convertX(width,b,len,padding) ,convertY(height,a,max,padding)]
const genPoints = (canvasWidth,canvasHeight,data,max,padding)=>data.map(convertPoint(canvasWidth,canvasHeight,max,data.length,padding))

const drawLine = (context,points)=>points.reduce((a,b)=>{
    context.moveTo(a[0],a[1])
    context.lineTo(b[0],b[1])
    return b
  })

const drawPic = (context,points,style)=>points.map((a)=>{


  /*绘制圆点*/
  context.strokeStyle=style.color
  context.beginPath()
  context.arc(a[0],a[1],12,0,2*Math.PI);
  context.fillStyle=style.color
  context.fill()
  context.stroke()


  /*绘制圆点空心部分*/
  context.strokeStyle=style.color
  context.beginPath()
  context.arc(a[0],a[1],9,0,2*Math.PI);
  context.fillStyle=style.bgColor
  context.fill()
  context.stroke()

})


const draw = (context,points,style)=>{
  /*设置宽度*/
  context.lineWidth =5
  context.strokeStyle=style.color
  /*绘制线条*/
  drawLine(context,points)
  context.stroke()
  /*绘制点*/
  drawPic(context,points,style)


}

/**
 * 绘制走势图
 * @param dom dom对象
 * @param data 数据
 * @param style 样式
 */
function trend(dom,data,style) {
  if(dom==null) return
  let [canvasWidth,canvasHeight] = [dom.width,dom.height]  =[dom.offsetWidth *6 ,dom.offsetHeight *6]


  const context = dom.getContext('2d')

  /*获取集合最大值*/
  const max = data.reduce(getMax)


  /*设置padding*/
  const padding ={left:50, right:50,top:50,bottom:50}

  /*计算坐标数组*/
  const points = genPoints(canvasWidth,canvasHeight,data,max,padding)

  /*绘制*/
  draw( context,points ,style)

}


export {trend}
使用
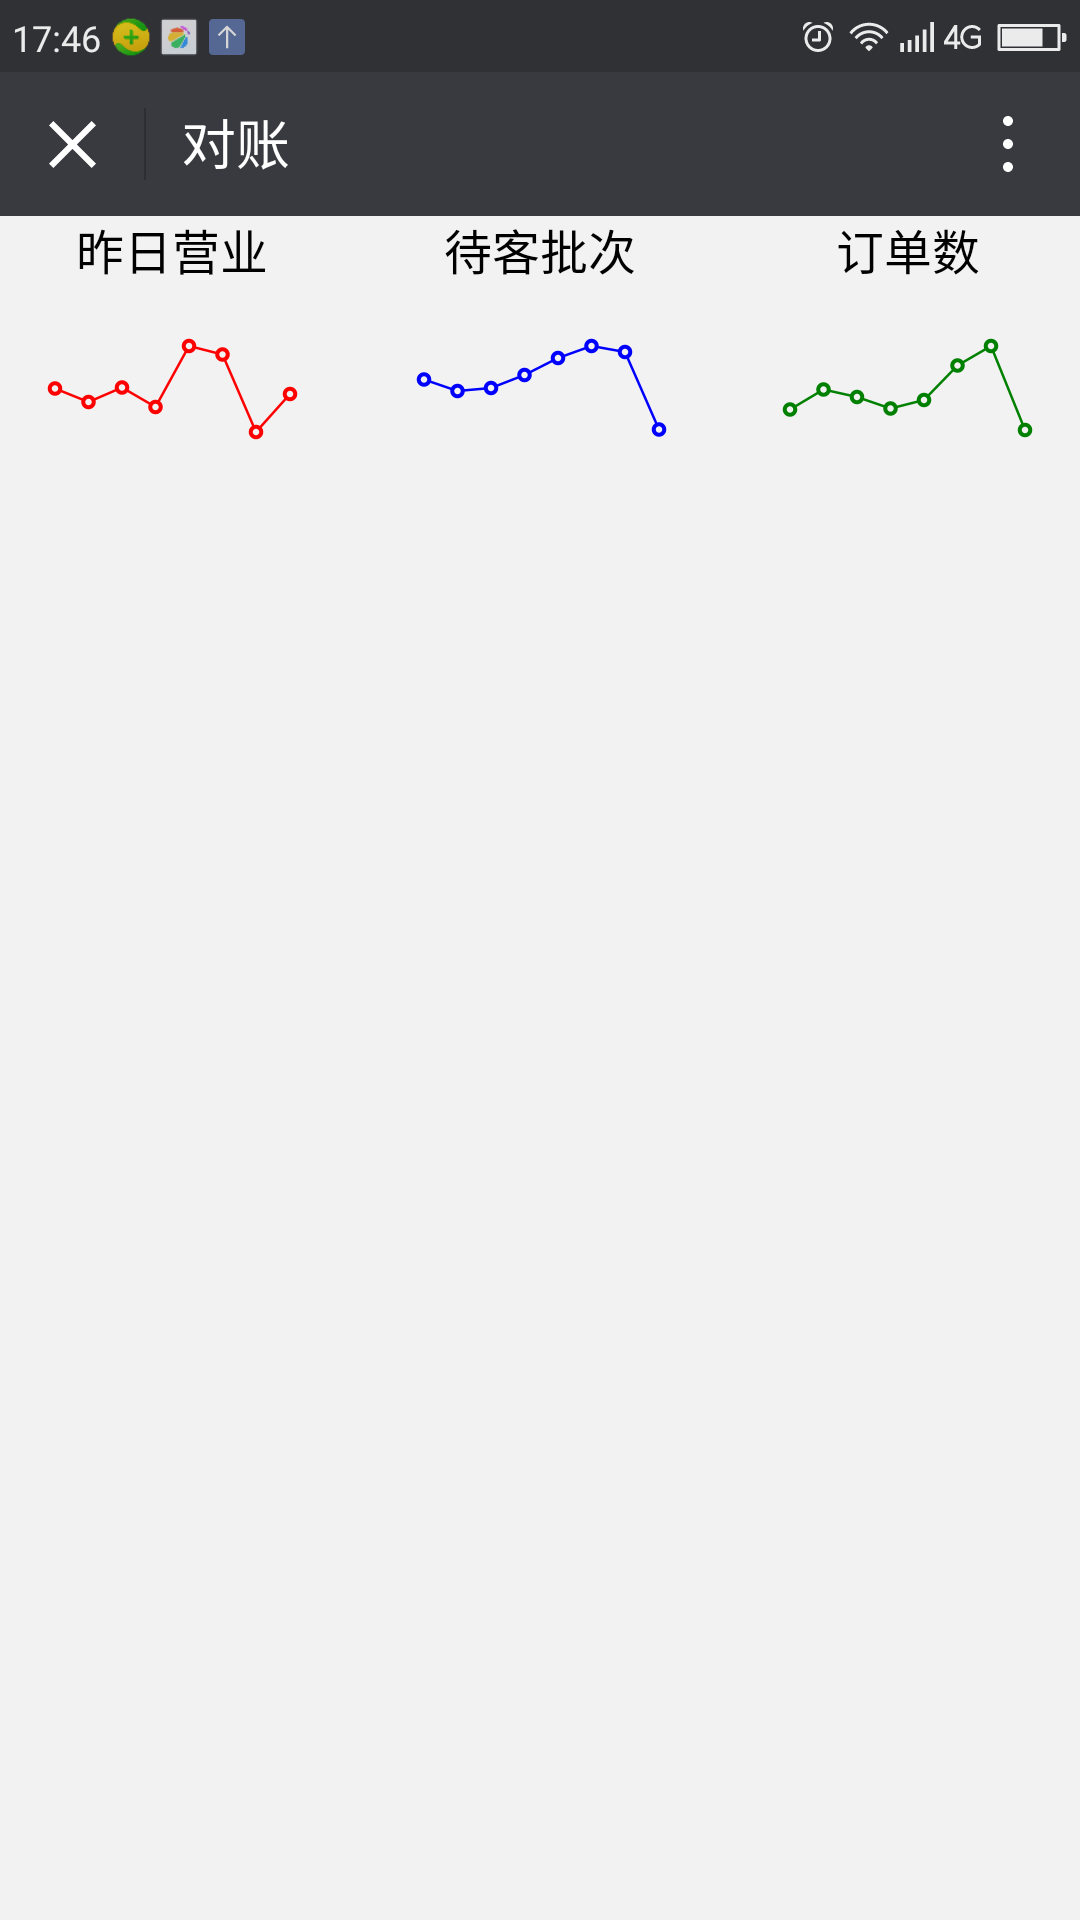
trend(this.$refs.graph1,[ 132, 101, 134, 90, 230, 210,33,120],{color:'red',bgColor:"rgb(242, 242, 242)"})

trend(this.$refs.graph2,[220, 182, 191, 234, 290, 330, 310,55],{color:'blue',bgColor:"rgb(242, 242, 242)"})

trend(this.$refs.graph3,[150, 232, 201, 154, 190, 330, 410,66],{color:'green',bgColor:"rgb(242, 242, 242)"})
效果图